SHAFT AI
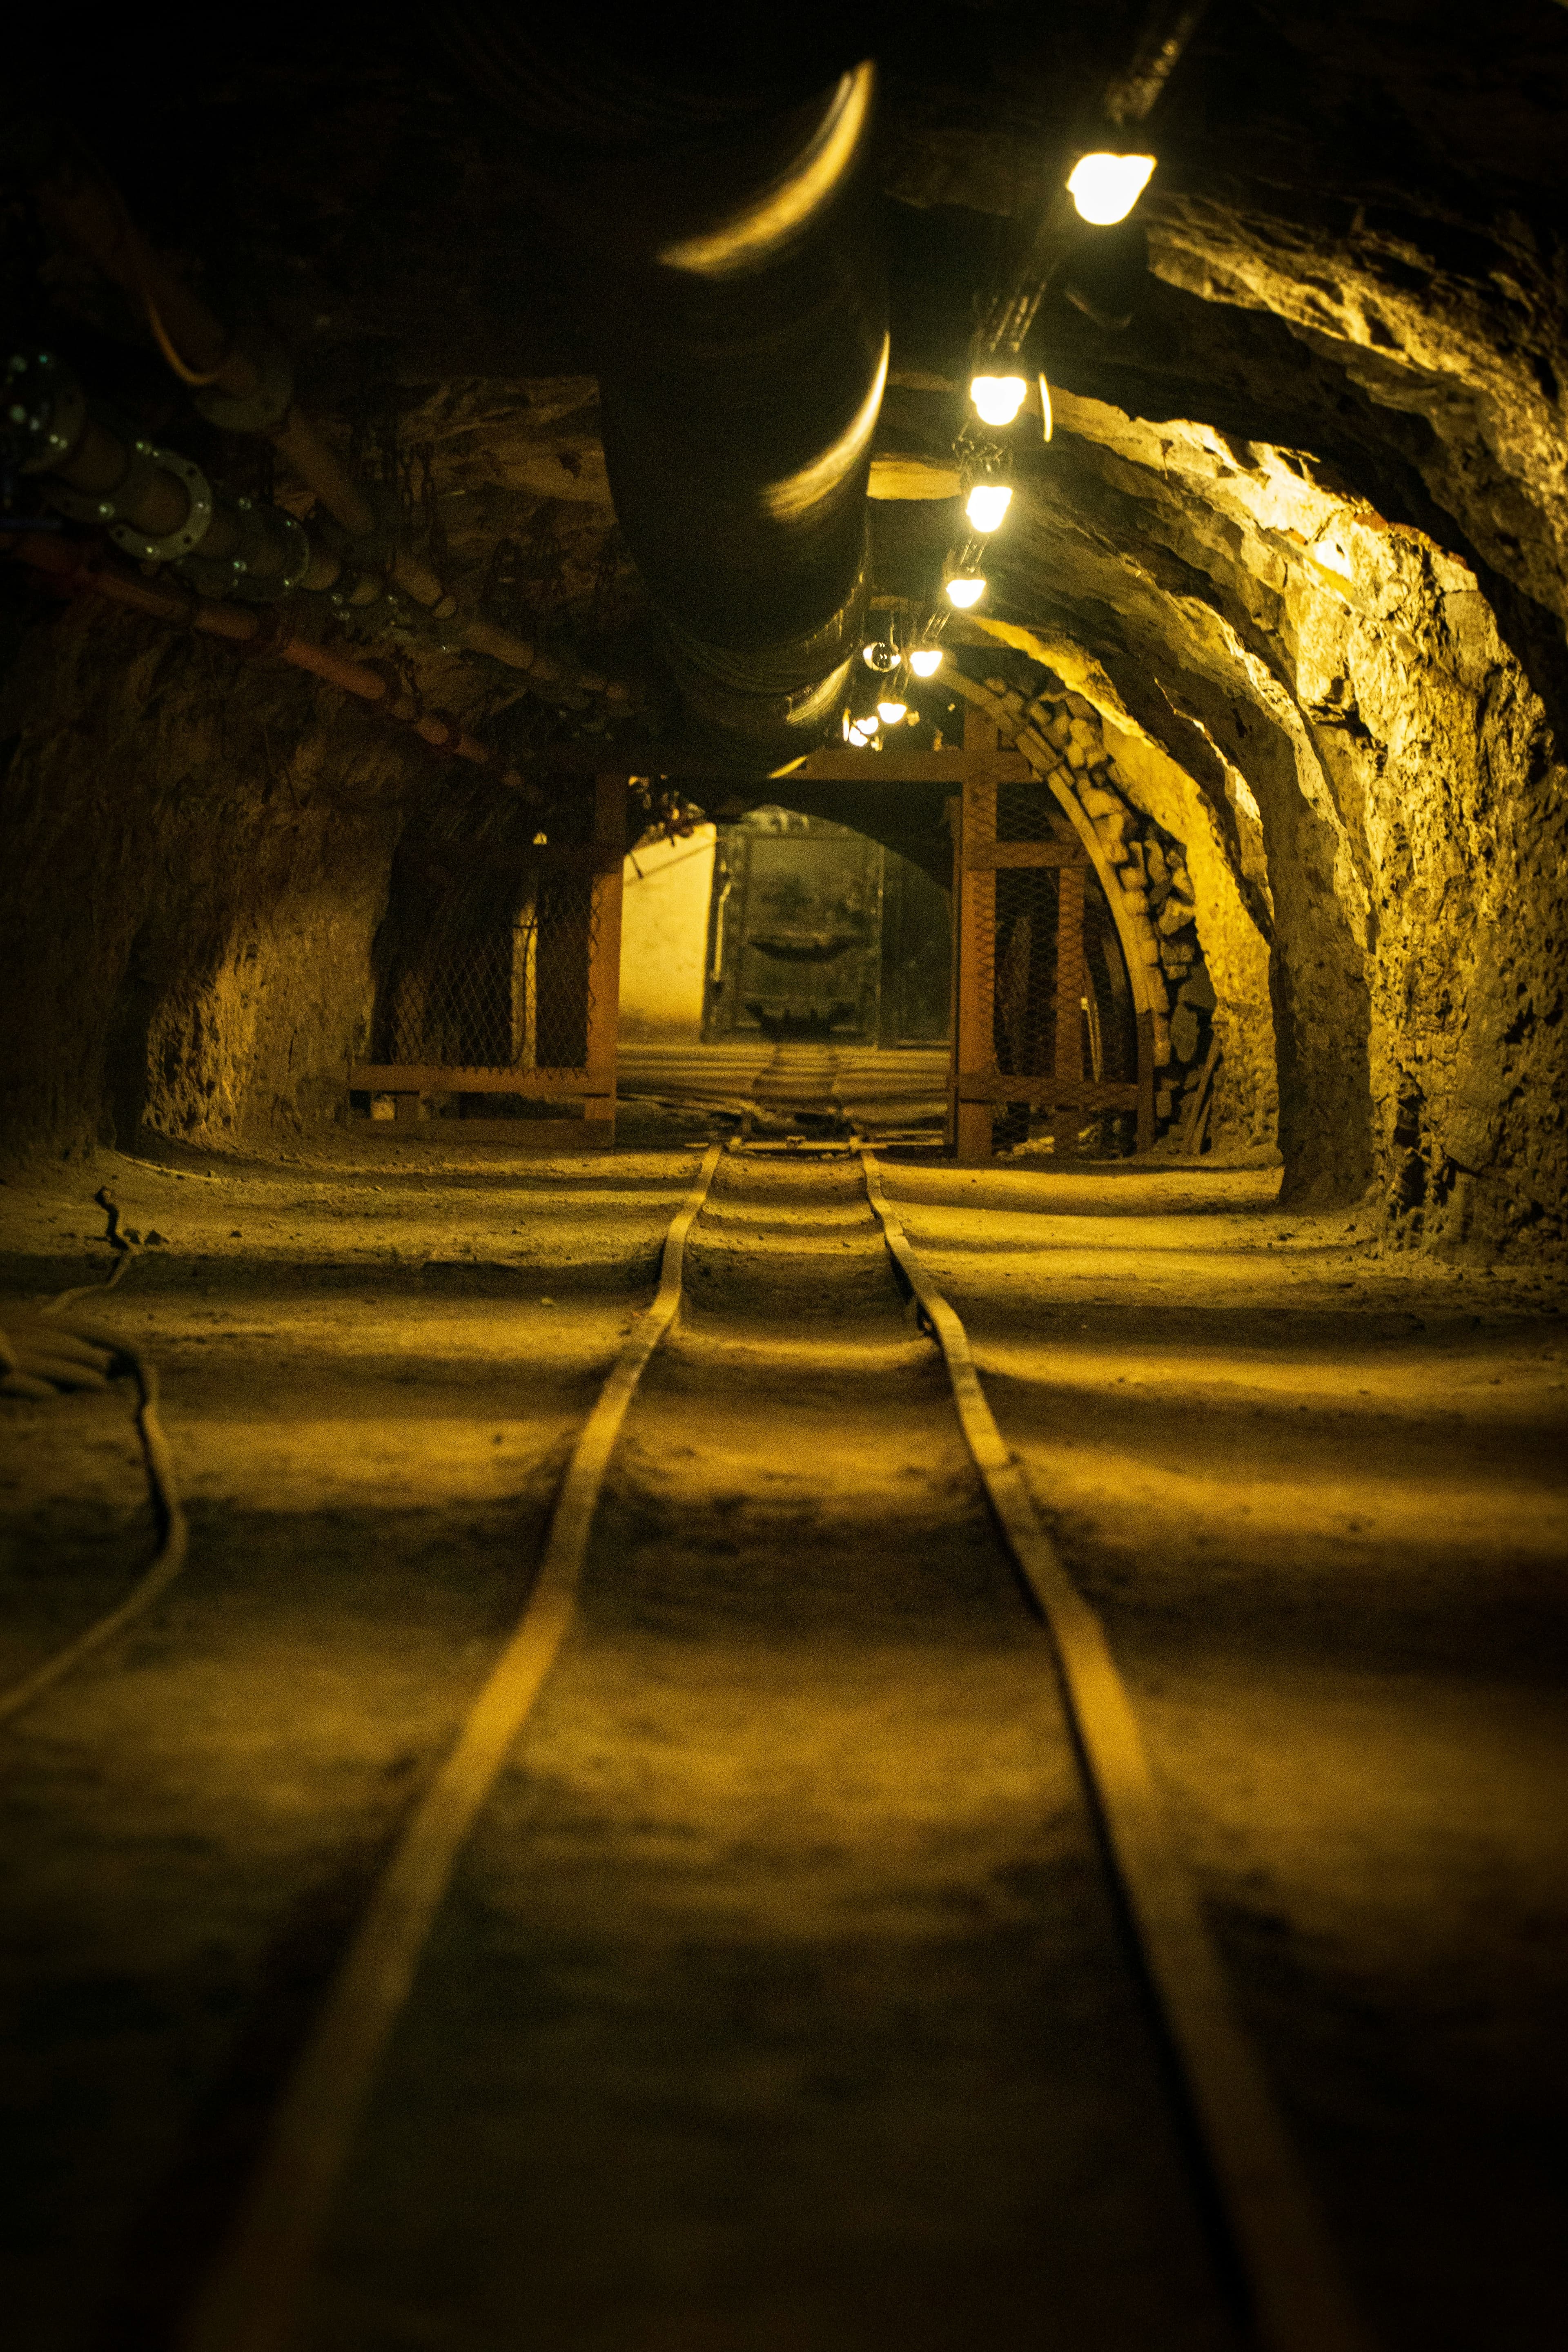
A lit underground tunnel.
A loaded haul truck on a mine haul road.

Built in Cape Town, South Africa

Scroll to expand

Shaft

AI

Underground mines · Built in Cape Town, South Africa

Know what every machine underground is doing, without asking operators to do more.

Shaft AI connects your fleet, safety and people data into one platform that works underground, offline and on your terms.

  • Works offline underground
  • On-site edge server
  • You own the data
  • Stop at any gate

The daily problem

Three gaps that show up on shift.

  • Which machines are costing you most?

    No clear view of availability, utilisation and repeat failures per unit.

  • One breakdown stops the decline.

    No live view of movement and congestion on single-access declines.

  • Systems nobody uses.

    Tools fail when they need constant operator input or reliable connectivity.

The fleet

Built around the machines already on the section.

Load-haul-dump loaders, haul trucks, and the single-access decline they move on.

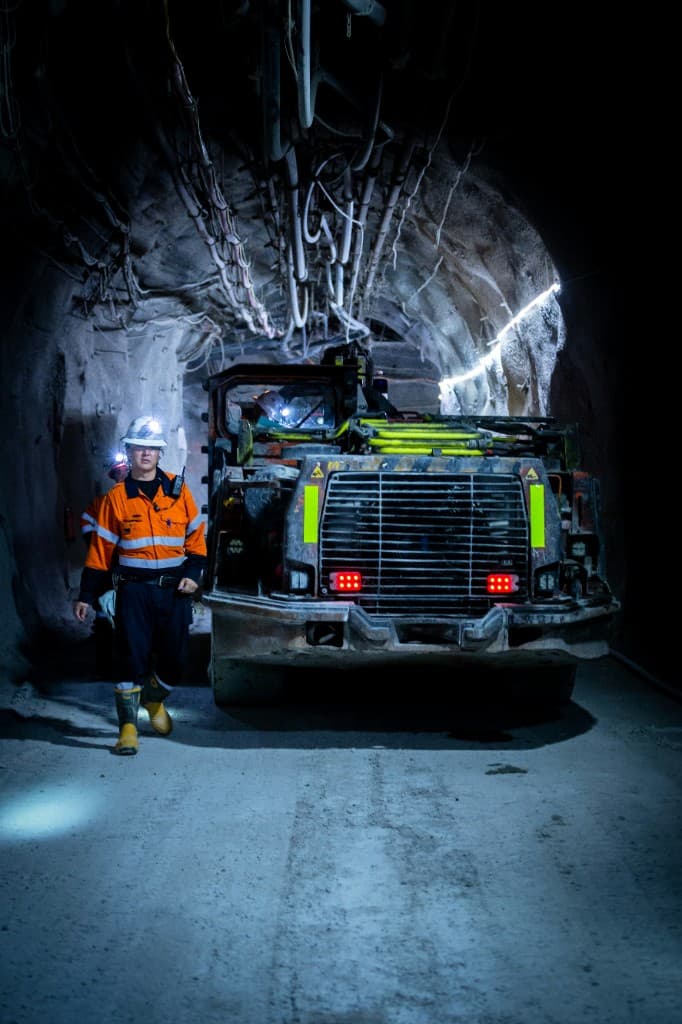
  • An operator walking beside an underground loader in a mine tunnel.
    Underground loader
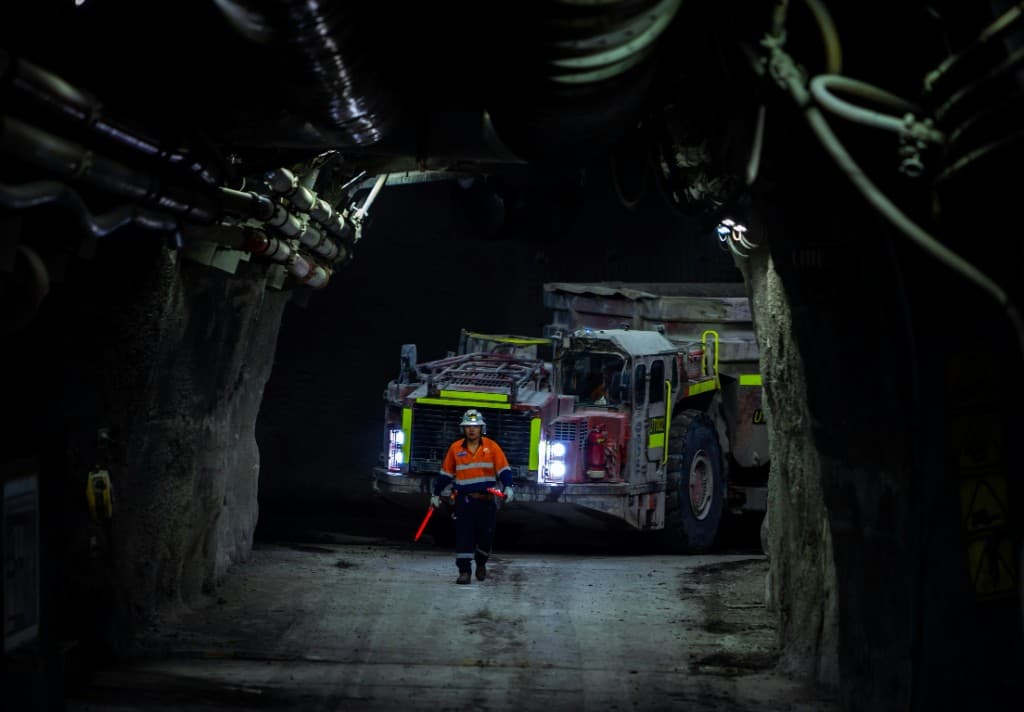
  • A worker with a light stick in front of a haul truck underground.
    Underground haul truck
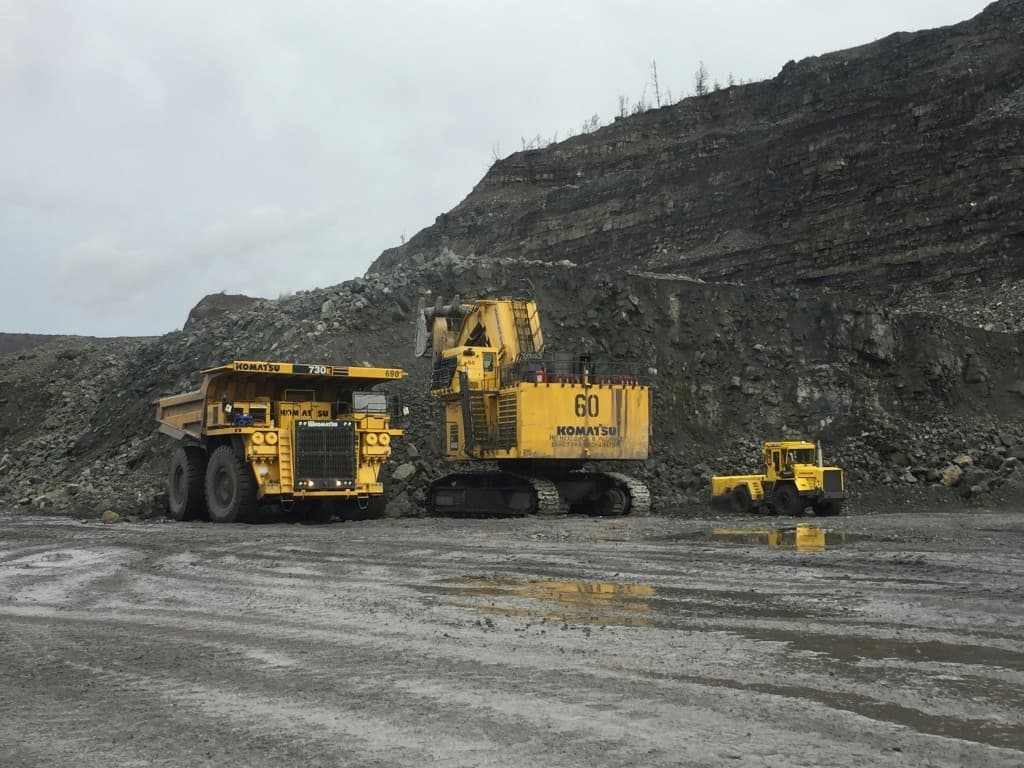
  • An excavator, haul truck and loader on a pit bench.
    Pit fleet
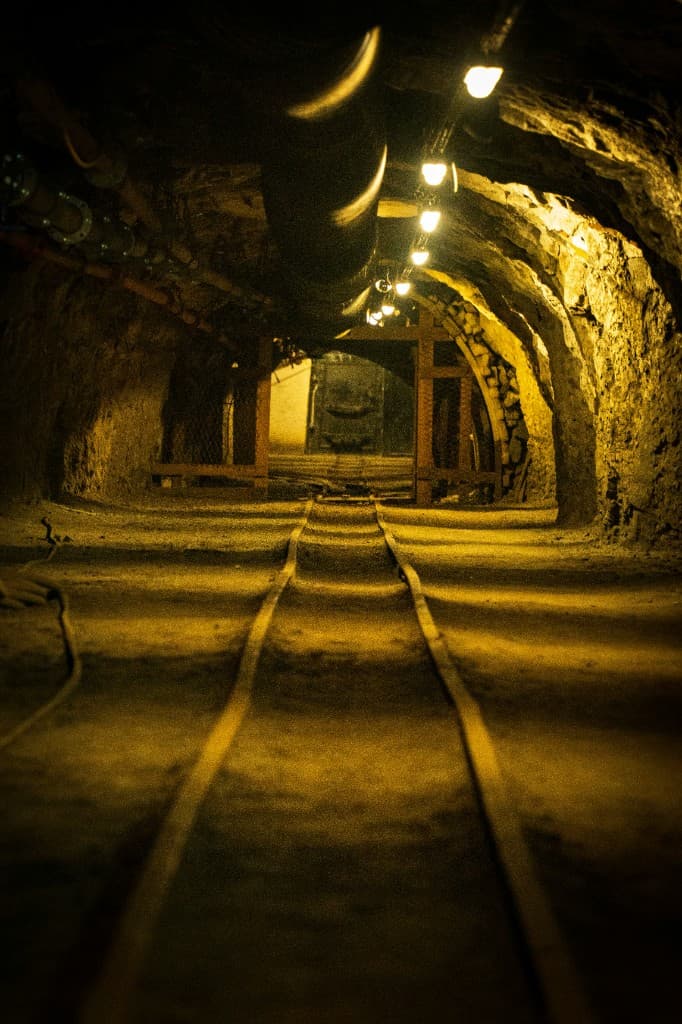
  • A lit underground tunnel with rails in the floor.
    Decline
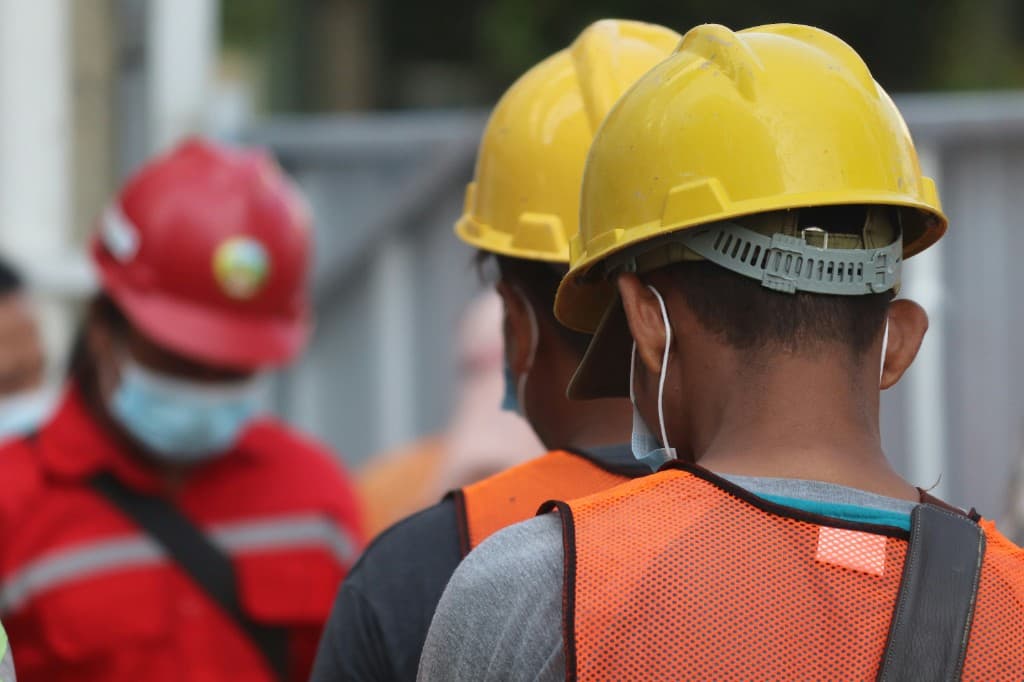
  • A shift crew in hard hats and high-visibility clothing.
    Shift crew
  • A person in a hard hat and high-visibility vest.
    On shift
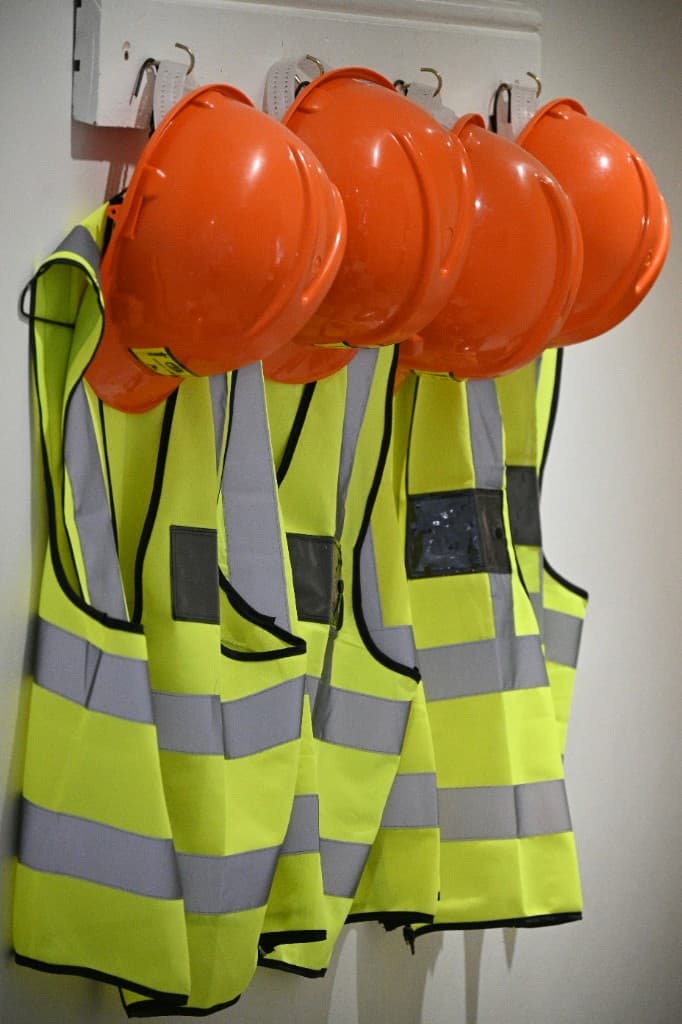
  • Hard hats and high-visibility vests hanging ready for a shift.
    Change room
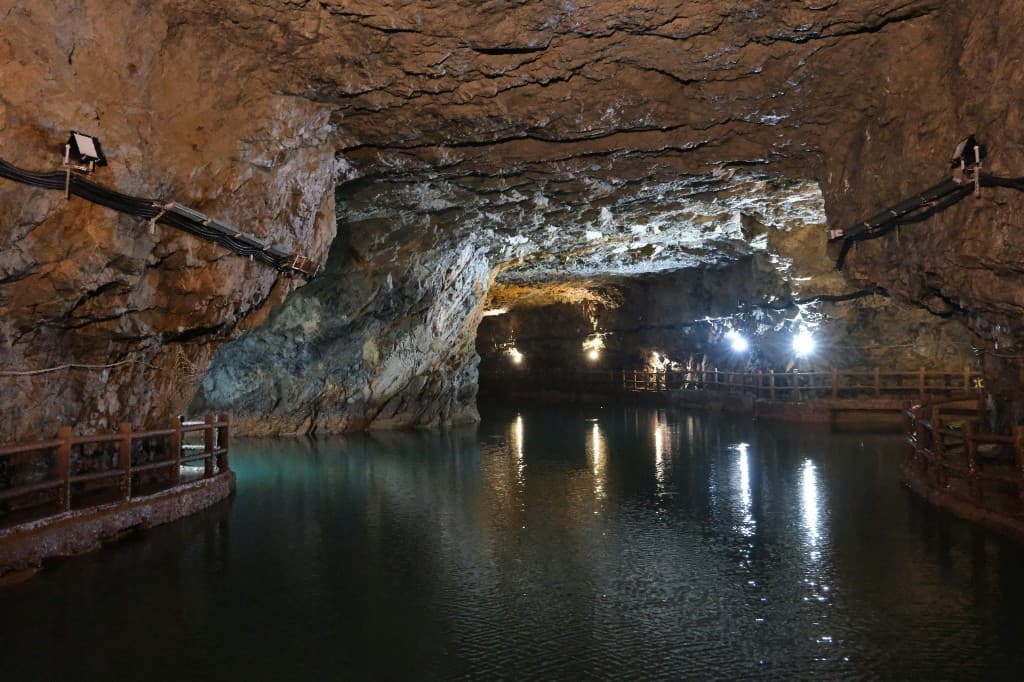
  • An underground excavation with water on the floor.
    Underground

How it works

Capture, connect, act.

The operator’s job stays the job. The record is collected around the work, not instead of it.

  1. 01

    Capture

    • Equipment trackers and OEM telematics
    • QR pre-use checks
    • Digital safety sign-offs
  2. 02

    Connect

    • One data platform
    • On-site edge server
    • Syncs when connectivity allows
    • Data owned by the client
  3. 03

    Act

    • Live availability and utilisation dashboards
    • Breakdown and cost-per-unit insights
    • Decline traffic view
    • Training records

Phased approach

Months, with a gate between them.

Each phase is a decision. The next one does not start unless you say so.

  1. Start

    01.

    Discovery

    Months 1–3

    Walk the section, audit what you already collect, and write a baseline you can measure against.
  2. Go / no-go gate

    02.

    Pilot

    Months 4–12

    One section. Supervisors use it on shift. If they do not, the programme stops here.

  3. Go / no-go gate

    03.

    Scale

    Months 13–24

    Take the same setup to further sections. No new promises, and another gate before each step.

  4. Go / no-go gate

    04.

    Optimise with AI

    Months 25–36

    Use the history you have built. Prediction only where the data is good enough to trust.

You can stop at any gate.

How the phases are priced

Start with a site assessment, not a sales pitch.

We come to the operation and walk a section with you. If the work is not worth doing, we say so.

Book a site assessment